-
How to expose kubernetes api-server metrics
Kubernetes api-server provides very interesting metrics which could make a difference when it comes to detecting potential security threats.
Accessing api-server requires a Token and a certificate. Both must be related to a ServiceAccount with sufficient permissions to access metrics endpoint. This post describes how to achieve such setup.
Namespace
Before to start, make sure your current context is using “default” namespacekubectl config set-context --current --namespace=default
Step 1: Create a new ServiceAccount
kubectl create serviceaccount metrics-explorer
Step 2: Create a new ClusterRole with sufficient permissions to access api-server metrics endpoint via HTTP GET
kind: ClusterRole
apiVersion: rbac.authorization.k8s.io/v1
metadata:
  name: metrics-explorer
rules:
- nonResourceURLs:
  - /metrics
  - /metrics/cadvisor
  verbs:
  - get
Step 3: Create new ClusterRoleBinding to bind the ServiceAccount with ClusterRole
kubectl create clusterrolebinding metrics-explorer:metrics-explorer --clusterrole metrics-explorer --serviceaccount default:metrics-explorer
Step 4: Export ServiceAccount’s token Secret’s name
SERVICE_ACCOUNT=metrics-explorer
SECRET=$(kubectl get serviceaccount ${SERVICE_ACCOUNT} -o json | jq -Mr '.secrets[].name | select(contains("token"))')
Step 5: Extract Bearer token from Secret and decode it
TOKEN=$(kubectl get secret ${SECRET} -o json | jq -Mr '.data.token' | base64 -d)Step 6: Extract, decode and write the ca.crt to a temporary location
kubectl get secret ${SECRET} -o json | jq -Mr '.data["ca.crt"]' | base64 -d > /tmp/ca.crtFinal step: Test access to metrics endpoint
curl -s <API-SERVER>/metrics --header "Authorization: Bearer $TOKEN" --cacert /tmp/ca.crt | less
Configuring as additional scrape target on Prometheus
Transfer the certificate file from api-server’s VM to Prometheus’ VM. (e.g. destination filename: /opt/api-server-files/ca.crt)
Save the TOKEN obtained on steps above to a file on Prometheus’ VM. (e.g. destination filename: /opt/api-server-files/api-server-token)
Edit Prometheus main configuration file (e.g. /etc/prometheus/prometheus.yml) and add the following scrape target:
- bearer_token_file: /opt/api-server-files/api-server-token job_name: kubernetes-apiservers static_configs: - targets: ['<API-SERVER-IP>:6443'] metrics_path: '/metrics' scheme: https tls_config: ca_file: /opt/api-server-files/ca.crt -
Kubernetes multi-node cluster deployment from scratch
Table of contents
Intro
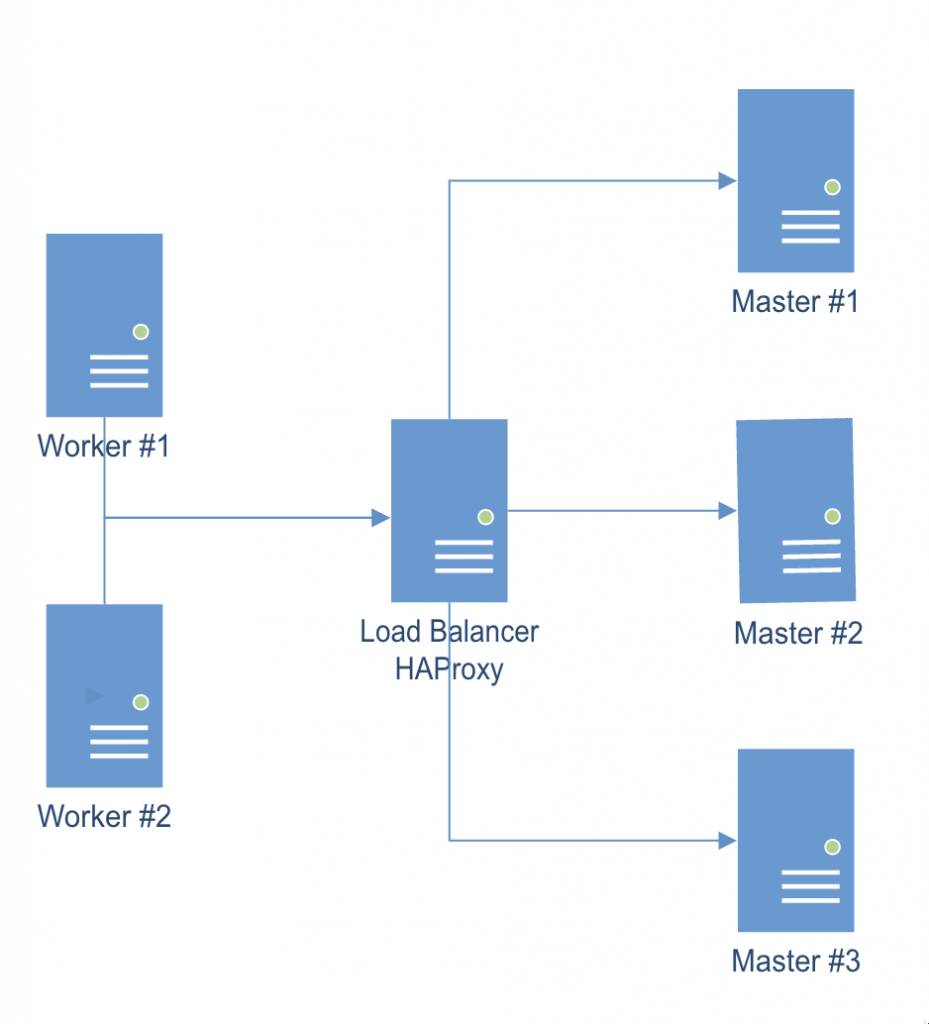
The following guide shows how to deploy and configure a multi-node kubernetes cluster on-premise.
Master/Worker nodes are using Rocky Linux 9.1 as host OS.
Load balancer in front of all master nodes, is running on Photon OS 4.
All VMs are using the same network.
Once all cluster members have been configured as explained below, the following configuration will be effective:
Multi-node cluster Preparing all hosts (master/worker nodes)
On all hosts (master/worker):
- Setup hostname DNS resolution (either via a DNS server or by adding entries to /etc/hosts)
- Setup appropriate firewalld rules:
- On master nodes:
sudo firewall-cmd --add-port=6443/tcp --permanent
sudo firewall-cmd --add-port=2379-2380/tcp --permanent
sudo firewall-cmd --add-port=10250/tcp --permanent
sudo firewall-cmd --add-port=10259/tcp --permanent
sudo firewall-cmd --add-port=10257/tcp --permanent
sudo firewall-cmd --reload
sudo firewall-cmd --list-all
- On worker nodes:
sudo firewall-cmd --add-port=10250/tcp --permanent
sudo firewall-cmd --add-port=30000-32767/tcp --permanent
sudo firewall-cmd --reload
sudo firewall-cmd --list-all
- Configure SELinux assigning “Permissive mode”
sudo setenforce 0
sudo sed -i 's/^SELINUX=enforcing$/SELINUX=permissive/' /etc/selinux/config
sestatus
- Enable kernel modules “overlay” and “br_netfilter”
sudo modprobe overlay sudo modprobe br_netfilter cat <<EOF | sudo tee /etc/modules-load.d/k8s.conf overlay br_netfilter EOF cat <<EOF | sudo tee /etc/sysctl.d/k8s.conf net.bridge.bridge-nf-call-iptables = 1 net.bridge.bridge-nf-call-ip6tables = 1 net.ipv4.ip_forward = 1 EOF sudo sysctl --system echo 1 > /proc/sys/net/ipv4/ip_forward- Disable swap
sudo swapoff -a
free -m
sudo sed -i '/ swap / s/^\(.*\)$/#\1/g' /etc/fstab
- Install container runtime: Containerd
sudo dnf install dnf-utils sudo yum-config-manager \ --add-repo \ https://download.docker.com/linux/centos/docker-ce.repo sudo dnf repolist sudo dnf makecache sudo dnf install containerd.io sudo mv /etc/containerd/config.toml /etc/containerd/config.toml.orig sudo containerd config default > /etc/containerd/config.toml- Edit file /etc/containerd/config.toml and change value of cgroup driver “SystemdCgroup = false” to “SystemdCgroup = true”. This will enable the systemd cgroup driver for the containerd container runtime.
sudo systemctl enable --now containerd
sudo systemctl is-enabled containerd
sudo systemctl status containerd
- Install kubernetes packages
cat <<EOF | sudo tee /etc/yum.repos.d/kubernetes.repo [kubernetes] name=Kubernetes baseurl=https://packages.cloud.google.com/yum/repos/kubernetes-el7-\$basearch enabled=1 gpgcheck=1 gpgkey=https://packages.cloud.google.com/yum/doc/yum-key.gpg https://packages.cloud.google.com/yum/doc/rpm-package-key.gpg exclude=kubelet kubeadm kubectl EOF sudo dnf repolist sudo dnf makecache sudo dnf install kubelet kubeadm kubectl --disableexcludes=kubernetes sudo systemctl enable --now kubelet- Install CNI plugin: Flannel (check for latest version available)
mkdir -p /opt/bin/
curl -fsSLo /opt/bin/flanneld https://github.com/flannel-io/flannel/releases/download/v0.20.2/flanneld-amd64
chmod +x /opt/bin/flanneld
Preparing the Load Balancer
In this example, we are using a Photon OS 4 image, but it can be any Linux distro on top of which we can run a HAProxy instance.
- Update existing packages
tdnf update / apt-get update && apt-get upgrade / yum update
- Install HAProxy
tdnf install -y haproxy / apt-get install -y haproxy / yum install -y haproxy
- Configure HAProxy to load balance the traffic between the three Kubernetes master nodes (Replace <K8S-MASTER-NODE-1> and <K8S-MASTER-NODE-1-IP> with your node name/IP)
$ sudo vim /etc/haproxy/haproxy.cfg
global
...
default
...
frontend kubernetes
bind <HAProxy Server IP>:6443
option tcplog
mode tcp
default_backend kubernetes-master-nodes
backend kubernetes-master-nodes
mode tcp
balance roundrobin
option tcp-check
server <K8S-MASTER-NODE-1> <K8S-MASTER-NODE-1-IP>:6443 check fall 3 rise 2
server <K8S-MASTER-NODE-2> <K8S-MASTER-NODE-2-IP>:6443 check fall 3 rise 2
server <K8S-MASTER-NODE-3> <K8S-MASTER-NODE-3-IP>:6443 check fall 3 rise 2
- Restart the service
$ sudo systemctl restart haproxy
Installing client tools
Steps below relate to preparation of TLS certificate that will be used to communicate with each etcd instance.
TLS certificate can be prepared on any of the hosts, on a separate one as well, since the TLS certificate obtained will then be copied to all relevant hosts.
CFSSL (Cloud Flare SSL tool)
- Download the binaries and grant execution permission
$ wget https://pkg.cfssl.org/R1.2/cfssl_linux-amd64
$ wget https://pkg.cfssl.org/R1.2/cfssljson_linux-amd64
$ chmod +x cfssl*
- Move the binaries to /usr/local/bin and verify the installation
$ sudo mv cfssl_linux-amd64 /usr/local/bin/cfssl
$ sudo mv cfssljson_linux-amd64 /usr/local/bin/cfssljson
$ cfssl version
Generating TLS certificate
- Create a Certification Authority
$ vim ca-config.json { "signing": { "default": { "expiry": "8760h" }, "profiles": { "kubernetes": { "usages": ["signing", "key encipherment", "server auth", "client auth"], "expiry": "8760h" } } } }- Create the certificate authority signing request configuration file
$ vim ca-csr.json { "CN": "Kubernetes", "key": { "algo": "rsa", "size": 2048 }, "names": [ { "C": "IE", "L": "Cork", "O": "Kubernetes", "OU": "CA", "ST": "Cork Co." } ] }- Generate the certificate authority certificate and private key
$ cfssl gencert -initca ca-csr.json | cfssljson -bare ca
- Make sure that ca-key.pem and the ca.pem have been generated
Creating the certificate for the Etcd cluster
- Create the certificate signing request configuration file
$ vim kubernetes-csr.json { "CN": "kubernetes", "key": { "algo": "rsa", "size": 2048 }, "names": [ { "C": "IE", "L": "Cork", "O": "Kubernetes", "OU": "Kubernetes", "ST": "Cork Co." } ] }- Generate the certificate and private key (Replace <MASTER-NODE-1-IP>,<MASTER-NODE-2-IP>,<MASTER-NODE-3-IP>,<LOAD-BALANCER-IP> accordingly)
$ cfssl gencert \
-ca=ca.pem \
-ca-key=ca-key.pem \
-config=ca-config.json \
-hostname=<MASTER-NODE-1-IP>,<MASTER-NODE-2-IP>,<MASTER-NODE-3-IP>,<LOAD-BALANCER-IP>,127.0.0.1,kubernetes.default \
-profile=kubernetes kubernetes-csr.json | \
cfssljson -bare kubernetes
- Verify that the kubernetes-key.pem and the kubernetes.pem file were generated
- Copy the certificate to all nodes
$ scp ca.pem kubernetes.pem kubernetes-key.pem root@MASTER-NODE-1:~
$ scp ca.pem kubernetes.pem kubernetes-key.pem root@MASTER-NODE-2:~
$ scp ca.pem kubernetes.pem kubernetes-key.pem root@MASTER-NODE-3:~
$ scp ca.pem kubernetes.pem kubernetes-key.pem root@LOAD-BALANCER:~
$ scp ca.pem kubernetes.pem kubernetes-key.pem root@WORKER-NODE-1:~
$ scp ca.pem kubernetes.pem kubernetes-key.pem root@WORKER-NODE-2:~
Etcd installation and configuration (only Master nodes)
sudo mkdir /etc/etcd /var/lib/etcd
- Move certificates to the configuration directory
$ sudo mv ~/ca.pem ~/kubernetes.pem ~/kubernetes-key.pem /etc/etcd
- Download the etcd binaries (check latest release available), extract and move to /usr/local/bin
$ wget https://github.com/etcd-io/etcd/releases/download/v3.4.23/etcd-v3.4.23-linux-amd64.tar.gz
$ tar zxvf etcd-v3.4.23-linux-amd64.tar.gz
$ sudo mv etcd-v3.4.23-linux-amd64/etcd* /usr/local/bin/
- Create an etcd systemd unit file (replace <CURRENT-MASTER-NODE-IP> with ip address of master node you are configuring and <OTHER-MASTER-NODE-IP> with ip address(es) of the remaining 2 master nodes
$ sudo vim /etc/systemd/system/etcd.service
[Unit]
Description=etcd
Documentation=https://github.com/coreos

[Service]
ExecStart=/usr/local/bin/etcd \
  --name <CURRENT-MASTER-NODE-IP> \
  --cert-file=/etc/etcd/kubernetes.pem \
  --key-file=/etc/etcd/kubernetes-key.pem \
  --peer-cert-file=/etc/etcd/kubernetes.pem \
  --peer-key-file=/etc/etcd/kubernetes-key.pem \
  --trusted-ca-file=/etc/etcd/ca.pem \
  --peer-trusted-ca-file=/etc/etcd/ca.pem \
  --peer-client-cert-auth \
  --client-cert-auth \
  --initial-advertise-peer-urls https://<CURRENT-MASTER-NODE-IP>:2380 \
  --listen-peer-urls https://0.0.0.0:2380 \
  --listen-client-urls https://<CURRENT-MASTER-NODE-IP>:2379,http://127.0.0.1:2379 \
  --advertise-client-urls https://<CURRENT-MASTER-NODE-IP>:2379 \
  --initial-cluster-token etcd-cluster-0 \
  --initial-cluster <CURRENT-MASTER-NODE-IP>=https://<CURRENT-MASTER-NODE-IP>:2380,<OTHER-MASTER-NODE-IP>=https://<OTHER-MASTER-NODE-IP>:2380,<OTHER-MASTER-NODE-IP>=https://<OTHER-MASTER-NODE-IP>:2380 \
  --initial-cluster-state new \
  --data-dir=/var/lib/etcd
Restart=on-failure
RestartSec=5

[Install]
WantedBy=multi-user.target
- Reload daemon configuration files and enable service to be started at boot
$ sudo systemctl daemon-reload
$ sudo systemctl enable etcd
- Repeat steps above on all master nodes and then:
- Start the service on all master nodes
$ sudo systemctl start etcd
- Wait a few seconds and check that the cluster is up and synchronised (run the command on all master nodes)
$ ETCDCTL_API=3 etcdctl member list
Master nodes initialisation
Master node #1
- Create a configuration file for kubeadm (replace values of <MASTER-NODE-1/2/3-IP> and <LOAD-BALANCER-IP> accordingly
$ vim config.yaml apiVersion: kubeadm.k8s.io/v1beta3 kind: ClusterConfiguration etcd: external: endpoints: - https://<MASTER-NODE-1-IP>:2379 - https://<MASTER-NODE-2-IP>:2379 - https://<MASTER-NODE-3-IP>:2379 caFile: /etc/etcd/ca.pem certFile: /etc/etcd/cc-ha.pem keyFile: /etc/etcd/cc-ha-key.pem networking: podSubnet: "10.244.0.0/24" controlPlaneEndpoint: "<LOAD-BALANCER-IP>:6443" apiServer: extraArgs: apiserver-count: "3" certSANs: - "<LOAD-BALANCER-IP>" timeoutForControlPlane: 4m0s- Initialize the machine as a master node
$ sudo kubeadm init --config=config.yaml
mkdir -p $HOME/.kube
sudo cp -i /etc/kubernetes/admin.conf $HOME/.kube/config
sudo chown $(id -u):$(id -g) $HOME/.kube/config
- Install CNI plugin
kubectl apply -f https://raw.githubusercontent.com/flannel-io/flannel/master/Documentation/kube-flannel.yml
- Copy the certificate to the two other master nodes
$ sudo scp -r /etc/kubernetes/pki root@<MASTER-NODE-2-IP>:~
$ sudo scp -r /etc/kubernetes/pki root@<MASTER-NODE-3-IP>:~
Master node #2
- Remove the apiserver.crt and apiserver.key
$ rm ~/pki/apiserver.*
- Move the certificates to the /etc/kubernetes directory
$ sudo mv ~/pki /etc/kubernetes/
- Create a configuration file for kubeadm (same content as file above used on master node #1)
- Initialize the machine as a master node
$ sudo kubeadm init --config=config.yaml
mkdir -p $HOME/.kube
sudo cp -i /etc/kubernetes/admin.conf $HOME/.kube/config
sudo chown $(id -u):$(id -g) $HOME/.kube/config
Master node #3
Same identical steps as master node #2.
Copy the kubeadm join command created when adding master nodes: It will be required to join worker nodes.
Worker nodes initialisation
Run the “kubeadm join” command copied from step above.
Checking nodes status
From a master node:
$ kubectl get nodes
Check nodes status (Ready/NotReady).
Possible issues
Node NotReady – Pod CIDR not available
Solution: Patch node with the following command (replace NODE-NAME and CIDR value accordingly).
kubectl patch node <NODE-NAME> -p '{"spec":{"podCIDR":"10.244.0.0/24"}}'Assigning role to worker nodes
kubectl label node <NODE-NAME> node-role.kubernetes.io/worker=worker
-
kube-proxy explained
Table of Contents
Intro
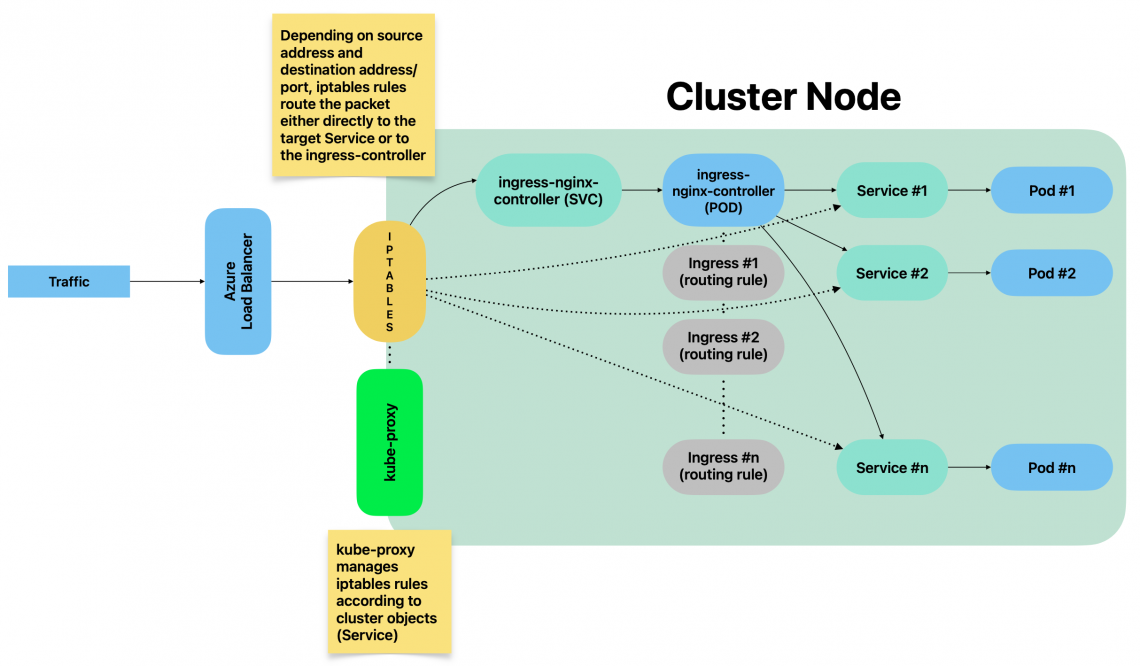
kube-proxy is a cluster component responsible for network traffic routing. Because of that, 1 instance is running on each cluster node.
It is responsible for routing traffic between cluster components but also for traffic incoming from outside the cluster.
It essentially implements rules part of Service(s). A Service represents a rule which is then implemented by kube-proxy.
kube-proxy operating modes
kube-proxy can implement network traffic rules 3 different ways:
- iptables (default)
- userspace (old, deprecated)
- IPVS (IP Virtual Server)
This page focuses on iptables mode.
kube-proxy – iptables mode
By using iptables mode, whenever a Service is created, related iptables rules are created on each node by kube-proxy.
Such rules are part of PREROUTING chain: This means that traffic is forwarded as soon as it gets into the kernel.
Listing all iptables PREROUTING chains
sudo iptables -t nat -L PREROUTING | column -tExample:
root@test:~# sudo iptables -t nat -L PREROUTING | column -t
Chain            PREROUTING  (policy  ACCEPT)
target           prot        opt      source    destination
cali-PREROUTING  all         --       anywhere  anywhere     /*        cali:6gwbT8clXdHdC1b1  */
KUBE-SERVICES    all         --       anywhere  anywhere     /*        kubernetes             service   portals  */
DOCKER           all         --       anywhere  anywhere     ADDRTYPE  match                  dst-type  LOCAL
Listing all rules part of a given chain
sudo iptables -t nat -L KUBE-SERVICES -n | column -tFor a better understanding, let’s consider the following example:
A new NodePort Service has been created with the following command:
kubectl expose deployment prometheus-grafana --type=NodePort --name=grafana-example-service -n monitoring
By executing the command above, a new Service got created:
[test@test ~]$ kubectl get svc/grafana-example-service -n monitoring
NAME                      TYPE       CLUSTER-IP       EXTERNAL-IP   PORT(S)          AGE
grafana-example-service   NodePort   10.111.189.177   <none>        3000:31577/TCP   100m
We did not specify any specific node port, therefore a random one between 30000 and 32767 has been automatically assigned: 31577.
Yaml manifest of Service object created with the command above:
kind: Service
metadata:
  labels:
    app.kubernetes.io/instance: prometheus
    app.kubernetes.io/managed-by: Helm
    app.kubernetes.io/name: grafana
    app.kubernetes.io/version: 9.2.4
    helm.sh/chart: grafana-6.43.5
  name: grafana-example-service
  namespace: monitoring
spec:
  clusterIP: 10.111.189.177
  clusterIPs:
  - 10.111.189.177
  externalTrafficPolicy: Cluster
  internalTrafficPolicy: Cluster
  ipFamilies:
  - IPv4
  ipFamilyPolicy: SingleStack
  ports:
  - nodePort: 31577
    port: 3000
    protocol: TCP
    targetPort: 3000
  selector:
    app.kubernetes.io/instance: prometheus
    app.kubernetes.io/name: grafana
  sessionAffinity: None
  type: NodePort
Assigning a custom nodePort
If you want to expose the Service on a custom node port, patch/edit the Service object by changing value of spec.ports.nodePortOnce the Service got created, we were able to reach grafana with the following URL: http://<NODE_IP_ADDRESS>:31577
This is made possible by kube-proxy
When Service grafana-example-service got created, kube-proxy has actually created iptables rules within KUBE_SERVICES chain which belongs to PREROUTING group, as well as a chain which collects all rules related to all NodePorts services:
sudo iptables -t nat -L KUBE-SERVICES -n  | column -t
Chain                      KUBE-SERVICES  (2   references)
target                     prot           opt  source       destination
KUBE-SVC-MDD5UT6CKUVXRUP3  tcp            --   0.0.0.0/0    10.98.226.44    /*  loki/loki-write:http-metrics                                      cluster   IP          */     tcp   dpt:3100
KUBE-SVC-FJOCBQUA67AJTJ4Y  tcp            --   0.0.0.0/0    10.103.120.150  /*  loki/loki-read:grpc                                               cluster   IP          */     tcp   dpt:9095
KUBE-SVC-GWDJ4KONO5OOHRT4  tcp            --   0.0.0.0/0    10.106.191.67   /*  loki/loki-gateway:http                                            cluster   IP          */     tcp   dpt:80
KUBE-SVC-XBIRSKPJDNCMT43V  tcp            --   0.0.0.0/0    10.111.129.177  /*  metallb-system/webhook-service                                    cluster   IP          */     tcp   dpt:443
KUBE-SVC-UZFDVIVO2N6QXLRQ  tcp            --   0.0.0.0/0    10.103.243.43   /*  monitoring/prometheus-kube-prometheus-operator:https              cluster   IP          */     tcp   dpt:443
KUBE-SVC-L5JLFDCUFDUOSAFE  tcp            --   0.0.0.0/0    10.96.126.22    /*  monitoring/prometheus-grafana:http-web                            cluster   IP          */     tcp   dpt:80
KUBE-SVC-NPX46M4PTMTKRN6Y  tcp            --   0.0.0.0/0    10.96.0.1       /*  default/kubernetes:https                                          cluster   IP          */     tcp   dpt:443
KUBE-SVC-OIUYAK75OI4PJHUN  tcp            --   0.0.0.0/0    10.111.189.177  /*  monitoring/grafana-example-service                                cluster   IP          */     tcp   dpt:3000
KUBE-SVC-FP56U3IB7O2NDDFT  tcp            --   0.0.0.0/0    10.108.50.82    /*  monitoring/prometheus-kube-prometheus-alertmanager:http-web       cluster   IP          */     tcp   dpt:9093
KUBE-SVC-TCOU7JCQXEZGVUNU  udp            --   0.0.0.0/0    10.96.0.10      /*  kube-system/kube-dns:dns                                          cluster   IP          */     udp   dpt:53
KUBE-SVC-JD5MR3NA4I4DYORP  tcp            --   0.0.0.0/0    10.96.0.10      /*  kube-system/kube-dns:metrics                                      cluster   IP          */     tcp   dpt:9153
KUBE-NODEPORTS             all            --   0.0.0.0/0    0.0.0.0/0       /*  kubernetes                                                        service   nodeports;
iptables applies all rules subsequently.
Rules must be interpreted like this:
- target: What to do whenever a given packet is matching all entry conditions (can be another rule or an action)
- prot: The protocol
- source: Source IP address of packet
- destination: Destination IP address of packet
- dpt: Destination port of packet
Example:
Consider the following rule:
target                     prot           opt  source       destination
KUBE-SVC-OIUYAK75OI4PJHUN  tcp            --   0.0.0.0/0    10.111.189.177  /*  monitoring/grafana-example-service                                cluster   IP          */     tcp   dpt:3000
Interpreting the rule
IF transmission protocol = tcp AND
whatever source IP address (0.0.0.0/0 = ANY) AND
destination IP address is 10.111.189.177 AND
destination port is 3000
THEN
apply rule KUBE-SVC-OIUYAK75OI4PJHUNMoving on with our sample Service, when it got created, the 2 following rules have been instantiated by kube-proxy:
Chain                      KUBE-SERVICES  (2   references)
target                     prot           opt  source       destination
KUBE-SVC-OIUYAK75OI4PJHUN  tcp            --   0.0.0.0/0    10.111.189.177  /*  monitoring/grafana-example-service                                cluster   IP          */     tcp   dpt:3000
KUBE-NODEPORTS             all            --   0.0.0.0/0    0.0.0.0/0       /*  kubernetes                                                        service   nodeports;
1st rule listed above consists of the following items:
[test@test~]$ sudo iptables -t nat -L KUBE-SVC-OIUYAK75OI4PJHUN -n  | column -t
Chain                      KUBE-SVC-OIUYAK75OI4PJHUN  (2   references)
target                     prot                       opt  source          destination
KUBE-MARK-MASQ             tcp                        --   !10.244.0.0/16  10.111.189.177  /*  monitoring/grafana-example-service  cluster  IP                 */  tcp  dpt:3000
KUBE-SEP-LAT64KIID4KEQMCP  all                        --   0.0.0.0/0       0.0.0.0/0       /*  monitoring/grafana-example-service  ->       10.244.0.115:3000  */
1st item (KUBE-MARK-MASQ) marks the TCP packed as “must go through IP masquerading” whenever the source IP address does NOT belong to 10.244.0.0/16 (in short words, whenever it is not internal traffic among cluster Pods part of the current node) AND if destination address is 10.111.189.177 AND if destination port is 3000.
Then, rule KUBE-SEP-LAT64KIID4KEQMCP is applied.
Rule KUBE-SEP-LAT64KIID4KEQMCP consists of the following items:
[test@test ~]$ sudo iptables -t nat -L KUBE-SEP-LAT64KIID4KEQMCP -n  | column -t
Chain           KUBE-SEP-LAT64KIID4KEQMCP  (1   references)
target          prot                       opt  source        destination
KUBE-MARK-MASQ  all                        --   10.244.0.115  0.0.0.0/0    /*  monitoring/grafana-example-service  */
DNAT            tcp                        --   0.0.0.0/0     0.0.0.0/0    /*  monitoring/grafana-example-service  */  tcp  to:10.244.0.115:3000
Which means:
IF source address is 10.244.0.115, regardless of the destination IP address, mark packet as to go through IP masquerading.
THEN, execute DNAT (Destination Network Address Translation) and forward it to 10.244.0.115:3000Traffic from source IP addresses which do NOT belong to cluster internal network would indeed get discarded, that explains why IP masquerading is required in this case.
Whenever the 1st rule is not matching, which means that the source IP address already belongs to internal cluster network, no IP masquerading is required, and in this case the 2nd rule above will be applied (rule KUBE-SEP-LAT64KIID4KEQMCP).
This rule simply forwards the packet to 10.244.0.155:3000 which relates to grafana Pod’s IP address:
[test@test ~]$ kubectl describe pods/prometheus-grafana-5f848c4987-btg95 -n monitoring
Name:             prometheus-grafana-5f848c4987-btg95
Namespace:        monitoring
Priority:         0
Service Account:  prometheus-grafana
Node:             cc-sauron/172.25.50.60
Start Time:       Wed, 16 Nov 2022 15:10:34 +0100
Labels:           app.kubernetes.io/instance=prometheus
                  app.kubernetes.io/name=grafana
                  pod-template-hash=5f848c4987
Annotations:      checksum/config: b9e953e845ac788d3c1ac8894062e8234ed2fd5b5ca91d5908976c4daf5c4bb8
                  checksum/dashboards-json-config: 01ba4719c80b6fe911b091a7c05124b64eeece964e09c058ef8f9805daca546b
                  checksum/sc-dashboard-provider-config: fbdb192757901cdc4f977c611f5a1dceb959a1aa2df9f92542a0c410ce3be49d
                  checksum/secret: 12768ec288da87f3603cb2ca6c39ebc1ce1c2f42e0cee3d9908ba1463576782a
Status:           Running
IP:               10.244.0.115
The traffic therefore eventually reaches the Pod either by going through IP masquerading (re-mapping source IP address) or directly, depending on the initial source IP address.
Because of such rule, whenever a client connects to http://<NODE_IP_ADDRESS>:31577 even though there are no LISTENING sockets on the node, traffic is forwarded to the grafana Pod.
Should any process open a socket and bind it to the same port (31577, in this case), the Pod would still receive all traffic directed to that port since iptables rules are applied as soon as the packet reaches the kernel.
We can summarise the traffic flow – from external systems – like this:
External references
The following pages helped a lot:
- https://medium.com/google-cloud/kubernetes-nodeport-vs-loadbalancer-vs-ingress-when-should-i-use-what-922f010849e0
- https://www.learnsteps.com/how-exactly-kube-proxy-works-basics-on-kubernetes/
- https://www.cyberciti.biz/faq/howto-iptables-show-nat-rules/
- https://ronaknathani.com/blog/2020/07/kubernetes-nodeport-and-iptables-rules/
-
Cloud Security – Curiefense deployment and configuration
Table of Contents
Intro
Curiefense is an open source project managed by Reblaze (see https://www.reblaze.com/).
It adds a security layer on top of your existing stack by scanning inbound network traffic.
It comes with a set of pre-configured rules out of the box which cover most of the known threats.
Full product documentation is available here: https://docs.curiefense.io/
Overview
Curiefense stack is made up of several components:
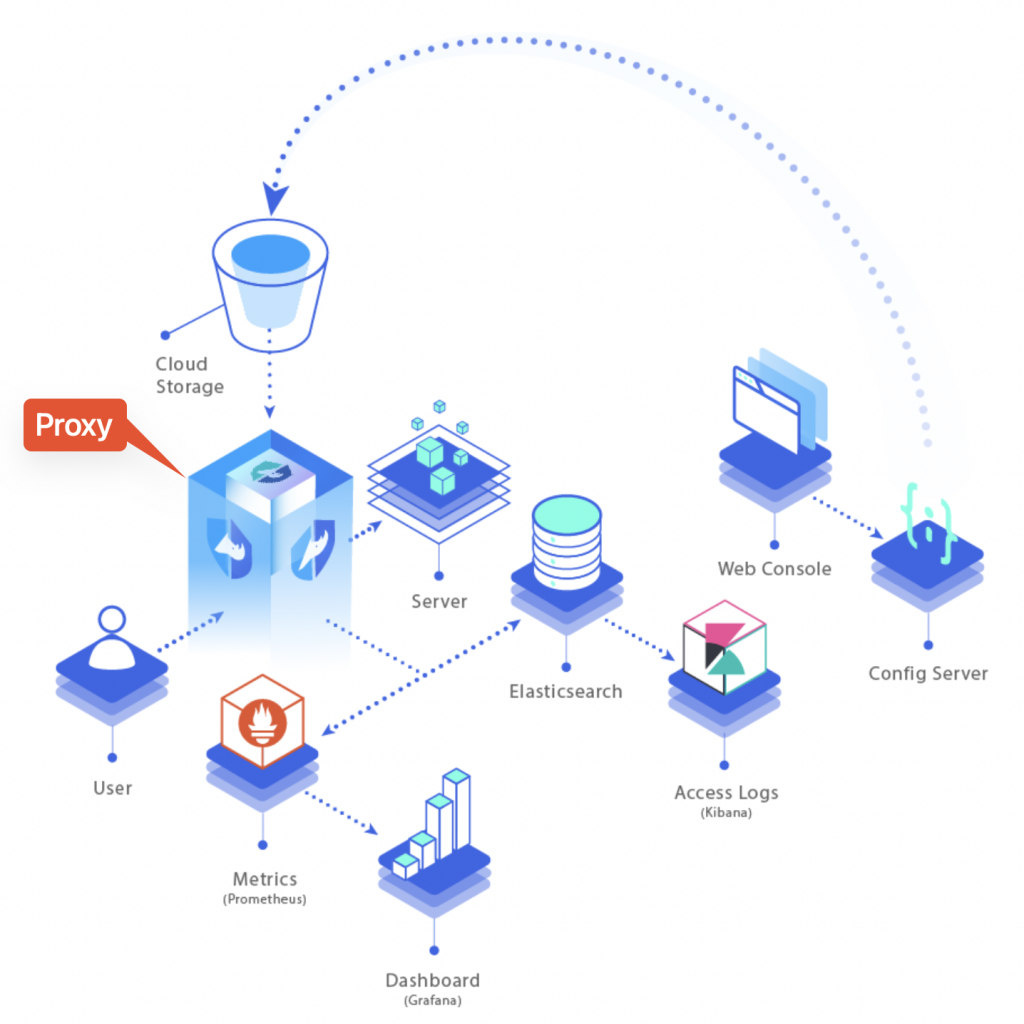
Curiefense full stack overview As viewable from the overview diagram above, all the incoming traffic has to go through the proxy. That’s where all rules are applied and traffic gets monitored and filtered, before to be routed to its final destination (the server).
Each inbound request gets logged and becomes part of metrics (data is stored into a mongoDB and Prometheus instance) and traffic logs (stored into Elasticsearch).
Metrics can then be exposed to Grafana and traffic logs become available either on Kibana or Grafana as well (by adding an extra data source, referring to Elasticsearch).
Rules that determine whether incoming traffic is eligible to be accepted/rejected or just tagged for future analysis are accessible through the Config Server (data is stored into a Redis instance).
Deploying as NGINX-Ingress
Official documentation provides instructions to deploy curiefense on top of an existing kubernetes cluster so that it gets attached to the ingress-controller (nginx).
Official how-to guide is available here: https://docs.curiefense.io/installation/deployment-first-steps/nginx-ingress
The steps included on the official guide linked above include the Config Server, the corresponding redis data store, but do NOT include all the other components (proxy, prometheus, mongodb, elasticsearch, grafana, kibana).
Step-by-step guide
- Create a new namespace:
kubectl create namespace curiefense
- In case you need to use a local bucket (rather than storage hosted on some cloud provider):
- create file secret.yaml with following content:
export CURIE_BUCKET_LINK=file:///u01/curiefense/prod/manifest.json
- Create a Secret:
kubectl create secret generic curiesync --from-file=secret.yaml --dry-run=client -o yaml > curiesync-secret.yaml
kubectl apply -f curiesync-secret.yaml -n curiefense
- Create file values.ingress.yaml with following content:
controller: image: repository: curiefense/curiefense-nginx-ingress tag: e2bd0d43d9ecd7c6544a8457cf74ef1df85547c2 volumes: - name: curiesync secret: secretName: curiesync volumeMounts: - name: curiesync mountPath: /etc/curiefense- Install the helm chart:
helm repo add nginx-stable https://helm.nginx.com/stable
helm repo update
helm -n curiefense install --version 0.11.1 -f values.ingress.yaml ingress nginx-stable/nginx-ingress
(wrt version to use, see https://github.com/nginxinc/kubernetes-ingress/releases/tag/v2.0.1)
- Create a file s3cfg-secret.yaml with the following content (dummy secret values since we are not using a s3 bucket but this secret is required to start up the application):
apiVersion: v1 kind: Secret metadata: name: s3cfg namespace: curiefense type: Opaque stringData: s3cfg: | [default] access_key = test secret_key = test- Create the secret:
kubectl -n curiefense apply -f s3cfg-secret.yaml
- Create a file values.curiefense.yaml with the following content:
global: proxy: frontend: "nginx" settings: curieconf_manifest_url: "file:///u01/curiefense/prod/manifest.json"- Clone and install the git repo:
git clone https://github.com/curiefense/curiefense-helm.git
helm install -n curiefense -f values.curiefense.yaml curiefense ./curiefense-helm/curiefense-helm/curiefense
- Expose the Config Server web UI to make it accessible via browser:
kubectl expose service uiserver -n curiefense --port=8088 --target-port=80 --external-ip=172.25.50.44 --name=uiserver-external
Deploying with docker-compose
In this case, the deployment instructions include all the items listed on the overview diagram above.
Official how-to deployment guide: https://docs.curiefense.io/installation/deployment-first-steps/docker-compose
Application components URLs
- Config Server web UI: http://YOUR_SERVER_IP:30080 (no authentication required by default)
- Grafana: http://YOUR_SERVER_IP:30300 (admin / admin)
Adding Elasticsearch data source on Grafana
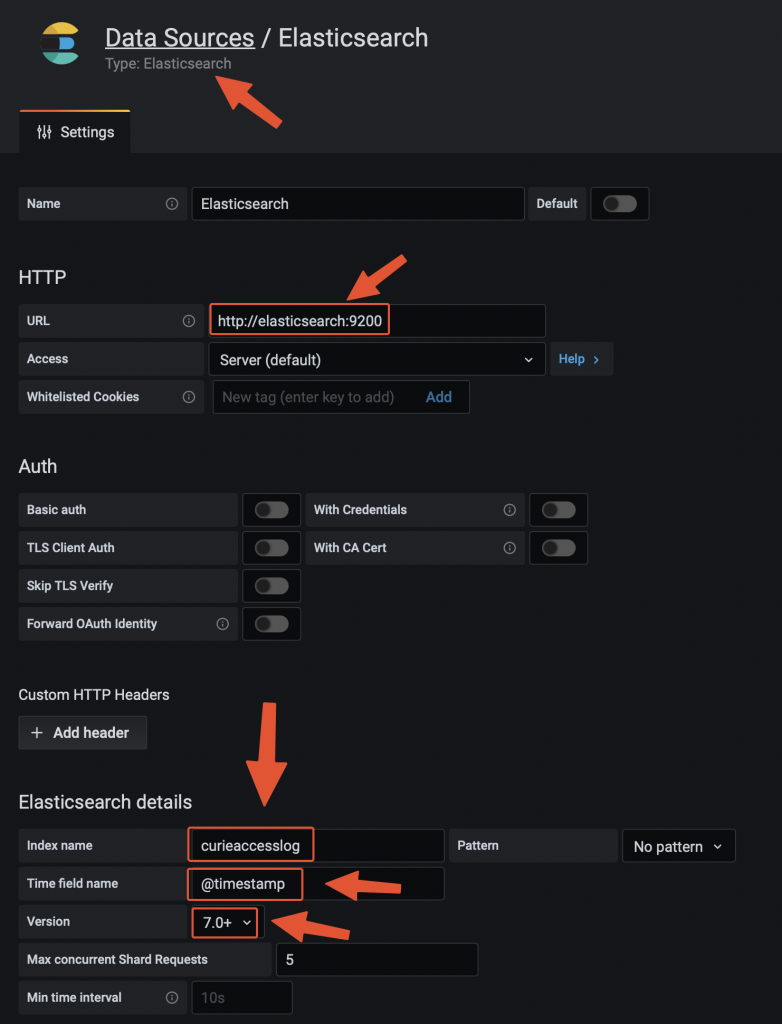
Adding the data source on Grafana Testing the traffic filtering rules
The deployment instructions linked above include a test echoserver to which we can address a malicious request and see how curiefense reacts to that.
One of the pre-defines rules relates to SQL injections attacks.
We can simulate the request via curl from the server itself:
curl -vvv 'http://localhost:30081/?username=%22delete%20from%20a%22'

Response:
*   Trying ::1:30081...
* Connected to localhost (::1) port 30081 (#0)
> GET /?username=%22delete%20from%20a%22 HTTP/1.1
> Host: localhost:30081
> User-Agent: curl/7.76.1
> Accept: */*
>
* Mark bundle as not supporting multiuse
< HTTP/1.1 473 Unknown
< content-length: 13
< content-type: text/plain
< date: Wed, 21 Dec 2022 09:14:19 GMT
< server: envoy
<
* Connection #0 to host localhost left intact
access denied
Request has been blocked with a HTTP 473 and error message “access denied”.
Response codes and messages can be customised through the Config Server UI:
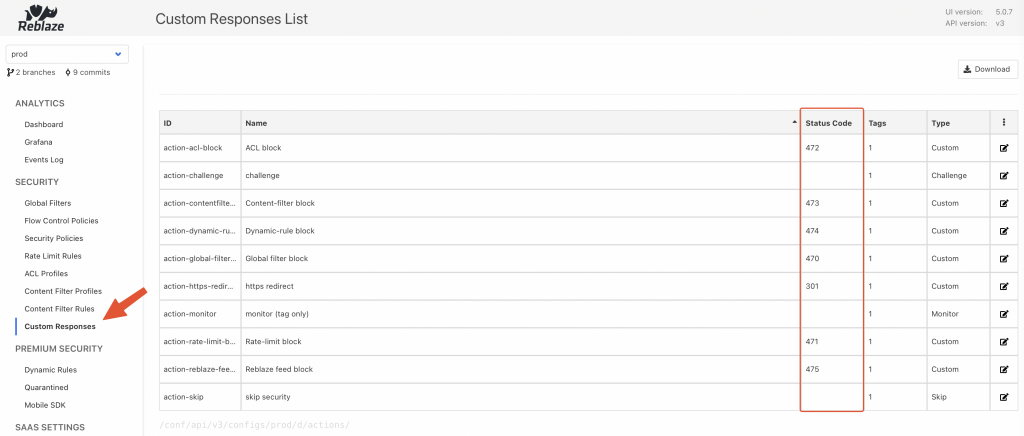
Curiefense config server UI 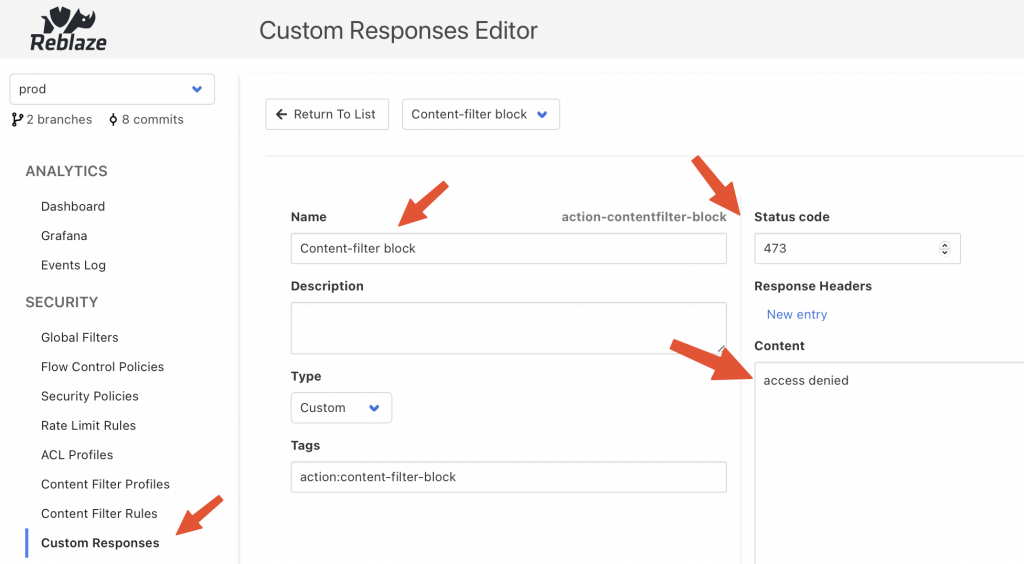
Curiefense content filter rule The request has been logged on Elasticsearch with the following JSON entry:
{
    "_id": "9VT2M4UBh8jqMva1ar--",
    "_type": "_doc",
    "_index": "curieaccesslog-2022.12.20-000001",
    "sort": [
        1671614064340,
        17
    ],
    "@timestamp": "2022-12-21T09:14:24.340Z",
    "global_filter_triggers": [
        {
            "id": "3c266a476d1e",
            "name": "test",
            "active": false
        }
    ],
    "response_code": 473,
    "logs": [
        "D 0µs Inspection init",
        "D 22µs Inspection starts (grasshopper active: true)",
        "D 38µs CFGLOAD logs start",
        "D 1258µs Loading configuration from /cf-config/current/config",
        "D 1645580µs Loaded profile __defaultcontentfilter__ with 188 rules",
        "D 40µs CFGLOAD logs end",
        "D 41µs Selected hostmap default security policy",
        "D 92µs Selected hostmap entry __root_entry__",
        "D 94µs map_request starts",
        "D 110µs headers mapped",
        "D 118µs geoip computed",
        "D 123µs uri parsed",
        "D 123µs no body to parse",
        "D 124µs args mapped",
        "D 198µs challenge phase2 ignored",
        "D 198µs Global filter decision [BlockReason { initiator: GlobalFilter { id: \"3c266a476d1e\", name: \"test\" }, location: Request, extra_locations: [], decision: Monitor, extra: Null }]",
        "D 216µs limit checks done",
        "D 222µs ACL result: bot(none)/human(none)",
        "D 503µs matching content filter signatures: true",
        "D 515µs signature matched [0..15] ContentFilterRule { id: \"100007\", operand: \"(\\\"|'|\\\\s|;)delete\\\\s+from\\\\s+.+(--|'|\\\"|;)\", risk: 5, category: \"sqli\", subcategory: \"statement injection\", tags: {\"rtc:injection\"} }",
        "D 545µs Content Filter checks done"
    ],
    "profiling": [
        {
            "name": "secpol",
            "value": 93
        },
        {
            "name": "mapping",
            "value": 184
        },
        {
            "name": "flow",
            "value": 209
        },
        {
            "value": 216,
            "name": "limit"
        },
        {
            "name": "acl",
            "value": 223
        },
        {
            "value": 544,
            "name": "content_filter"
        }
    ],
    "content_filter_triggers": [
        {
            "id": "100007",
            "risk_level": 5,
            "value": "\"delete from a\"",
            "name": "username",
            "request_element": "uri",
            "active": true
        }
    ],
    "log": {
        "offset": 0,
        "file": {
            "path": ""
        }
    },
    "proxy": [
        {
            "name": "geo_long"
        },
        {
            "name": "geo_lat"
        },
        {
            "name": "container",
            "value": "curieproxyenvoy"
        }
    ],
    "authority": "localhost:30081",
    "reason": "blocking - content filter 100007[lvl5] - [URI argument username=\"delete from a\"]",
    "headers": [
        {
            "name": "x-envoy-internal",
            "value": "true"
        },
        {
            "value": "3b962173-5af0-4c21-b7af-f7b631148f82",
            "name": "x-request-id"
        },
        {
            "value": "curl/7.76.1",
            "name": "user-agent"
        },
        {
            "name": "accept",
            "value": "*/*"
        },
        {
            "name": "x-forwarded-for",
            "value": "172.18.0.1"
        },
        {
            "value": "https",
            "name": "x-forwarded-proto"
        }
    ],
    "ip": "172.18.0.1",
    "uri": "/?username=%22delete%20from%20a%22",
    "processing_stage": 6,
    "security_config": {
        "cf_rules": 188,
        "rate_limit_rules": 4,
        "global_filters_active": 7,
        "revision": "10861a33c58a25fe433596a736d6af8803e85214",
        "acl_active": true,
        "cf_active": true
    },
    "path_parts": [
        {
            "name": "path",
            "value": "/"
        }
    ],
    "path": "/",
    "method": "GET",
    "curiesession": "ab026b48001ae1563689b0171cf7966cefc4f75524f1c3f403cfdfb7",
    "timestamp": "2022-12-21T09:14:20.243210800Z",
    "trigger_counters": {
        "content_filters_active": 1,
        "acl": 0,
        "acl_active": 0,
        "global_filters": 1,
        "global_filters_active": 0,
        "rate_limit": 0,
        "rate_limit_active": 0,
        "content_filters": 1
    },
    "acl_triggers": [],
    "ecs": {
        "version": "1.8.0"
    },
    "restriction_triggers": [],
    "arguments": [
        {
            "name": "username",
            "value": "\"delete from a\""
        }
    ],
    "rate_limit_triggers": [],
    "input": {
        "type": "stdin"
    },
    "host": {
        "name": "curieproxyenvoy"
    },
    "agent": {
        "hostname": "curieproxyenvoy",
        "ephemeral_id": "0e742beb-b416-44ad-880e-08b35c69229b",
        "id": "9fee5a67-484e-4ad9-8740-29ba9c8aa9ec",
        "name": "curieproxyenvoy",
        "type": "filebeat",
        "version": "7.13.3"
    },
    "cookies": [],
    "tags": [
        "cookies:0",
        "geo-region:nil",
        "action:content-filter-block",
        "geo-org:nil",
        "geo-city:nil",
        "cf-rule-subcategory:statement-injection",
        "cf-rule-id:100007",
        "geo-continent-code:nil",
        "action:monitor",
        "securitypolicy:default-security-policy",
        "host:localhost:30081",
        "ip:172-18-0-1",
        "all",
        "bot",
        "args:1",
        "geo-country:nil",
        "headers:6",
        "securitypolicy-entry:--root--",
        "aclid:--acldefault--",
        "aclname:acl-default",
        "contentfilterid:--defaultcontentfilter--",
        "cf-rule-category:sqli",
        "rtc:injection",
        "geo-subregion:nil",
        "contentfiltername:default-contentfilter",
        "cf-rule-risk:5",
        "geo-continent-name:nil",
        "geo-asn:nil",
        "network:nil",
        "status:473",
        "status-class:4xx"
    ],
    "curiesession_ids": []
}
Configuring as edge reverse proxy
Curiefense comes with an envoy proxy which can be used as edge proxy.
When following the deployment with docker-compose, this component is included.
There are some steps to be taken into account, when it comes to configuring as reverse proxy.
The curiefense envoy reverse proxy image is built on top of official envoy proxy image. For more details, see https://docs.curiefense.io/reference/services-container-images#curieproxy-envoy
Even though the official documentation linked above mentions 1 configuration, so that requests are proxied to 1 destination (TARGET_ADDRESS:TARGET_PORT), it actually comes pre-configured to route 2 requests toward 2 back-ends (both 443 and 80).
Standard envoy proxy (see https://www.envoyproxy.io/ ) can indeed be configured with multiple back-ends, but the docker image built on top of it by curiefense (see https://github.com/curiefense/curiefense/tree/main/curiefense/images/curieproxy-envoy ) is actually including 4 environment variables (2 for each back-end, 1 for the address and one for the port).
The docker-compose.yaml part of the repo (https://github.com/curiefense/curiefense.git) looks like this (available at https://github.com/curiefense/curiefense/tree/main/deploy/compose):
version: "3.7"
services:
  curieproxyenvoy:
    container_name: curieproxyenvoy
    hostname: curieproxyenvoy
    image: "curiefense/curieproxy-envoy:${DOCKER_TAG}"
    restart: always
    volumes:
      - curieproxy_config:/cf-config
      - ./filebeat/ilm.json:/usr/share/filebeat/ilm.json
      - ./filebeat/template.json:/usr/share/filebeat/template.json
    environment:
      - ENVOY_UID
      - TARGET_ADDRESS_A=${TARGET_ADDRESS_A:-echo}           # 1st back-end
      - TARGET_PORT_A=${TARGET_PORT_A:-8080}             # 1st back-end
      - TARGET_ADDRESS_B=${TARGET_ADDRESS_B:-juiceshop}      # 2nd back-end
      - TARGET_PORT_B=${TARGET_PORT_B:-3000}             # 2nd back-end
      - XFF_TRUSTED_HOPS
      - ENVOY_LOG_LEVEL
      - FILEBEAT
      - FILEBEAT_LOG_LEVEL
      - ELASTICSEARCH_URL=${ELASTICSEARCH_URL:-http://elasticsearch:9200}
      - KIBANA_URL=${KIBANA_URL:-http://kibana:5601}
    networks:
      curiemesh:
        aliases:
          - curieproxy
    ports:
      - "30081:80"                                           # routing traffic from host port 30081 to container port 80
      - "30082:81"                                           # routing traffic from host port 30082 to container port 81
      - "30444:443"                                          # routing traffic from host port 30444 to container port 443
      - "30445:444"                                          # routing traffic from host port 30445 to container port 444
      - "8001:8001"                                          # routing traffic from host port 8001 to container port 8001
    secrets:
      - curieproxysslcrt
      - curieproxysslkey
Environment variables referring to elastic/kibana endpoints are also listed.
The service attributes include also 2 secrets (curieproxysslcrt and curieproxysslkey): They refer to these objects, still part of same file docker-compose.yaml:
secrets:
  curieproxysslcrt:
    file: "curiesecrets/curieproxy_ssl/site.crt"
  curieproxysslkey:
    file: "curiesecrets/curieproxy_ssl/site.key"
Secrets relate to TLS certificate public and private keys that will be exposed by the reverse proxy.
The file path is relative and root folder is the same where docker-compose.yaml file is hosted (curiefense/deploy/compose where curiefense is the folder that was created when you cloned the git repo).
To configure your TLS public certificate you can either overwrite the 2 files above or change the “secrets” configuration within docker-compose.yaml
Regarding the ports to be exposed, as viewable from the code snippet above, by default 80 and 443 are not served. To expose them, the following ports configuration will do the job:
    ports:
      - "80:80"
      - "443:443"
Assuming you need just 1 back-end, the 2 remaining values to be customised relate to TARGET_ADDRESS_A and TARGET_PORT_A.
They both refer to environment variables.
Customising environment variables, when using docker-compose, can be achieved in 2 ways:
- defining their name/value within a file named .env available within the same folder of docker-compose.yaml (recommended)
- exporting the variable name/value as system-wide environment variable (e.g. export NAME=value). By doing so, you would override any value defined within .env file mentioned above.
To assign back-end IP/PORT we can therefore create/edit the file .env
TARGET_ADDRESS_A=back-end1.sample.demo
TARGET_PORT_A=443
curiefense proxy image has been re-built since, as it is, proxying over HTTPS is not working properly.
curieproxy-envoy image builds up the complete envoy.yaml configuration file (main configuration file for envoy proxy) by putting together the three following files, all available at ~/curiefense/curiefense/curieproxy
- envoy.yaml.head
- envoy.yaml.tls
- envoy.yaml.tail
Sections that needs to be adapted relate to envoy.yaml.tail:
  clusters:
  - name: target_site_a
    connect_timeout: 25s
    type: strict_dns # static
# START EXTRA SECTION 1
    transport_socket:
      name: envoy.transport_sockets.tls
      typed_config:
        "@type": type.googleapis.com/envoy.extensions.transport_sockets.tls.v3.UpstreamTlsContext
        common_tls_context:
          tls_certificates:
            - certificate_chain:
                filename: "/run/secrets/curieproxysslcrt"
              private_key:
                filename: "/run/secrets/curieproxysslkey"
          alpn_protocols: ["h2,http/1.1"]
# END EXTRA SECTION 1
    # Comment out the following line to test on v6 networks
    dns_lookup_family: V4_ONLY
    lb_policy: round_robin
# START EXTRA SECTION 2
    typed_extension_protocol_options:
      envoy.extensions.upstreams.http.v3.HttpProtocolOptions:
        "@type": type.googleapis.com/envoy.extensions.upstreams.http.v3.HttpProtocolOptions
        explicit_http_config:
          http2_protocol_options:
            initial_stream_window_size: 65536  # 64 KiB
            initial_connection_window_size: 1048576  # 1 MiB
# END EXTRA SECTION 2
    load_assignment:
      cluster_name: target_site_a
      endpoints:
      - lb_endpoints:
        - endpoint:
            address:
              socket_address:
                address: TARGET_ADDRESS_A
                port_value: TARGET_PORT_A
  - name: target_site_b
    connect_timeout: 25s
    type: strict_dns # static
    # Comment out the following line to test on v6 networks
    dns_lookup_family: V4_ONLY
    lb_policy: round_robin
    load_assignment:
      cluster_name: target_site_b
      endpoints:
      - lb_endpoints:
        - endpoint:
            address:
              socket_address:
                address: TARGET_ADDRESS_B
                port_value: TARGET_PORT_B
File envoy.yaml.tls:
  - name: tls
    address:
      socket_address:
        address: 0.0.0.0
        port_value: 443
    filter_chains:
    - filters:
      - name: envoy.filters.network.http_connection_manager
        typed_config:
          "@type": type.googleapis.com/envoy.extensions.filters.network.http_connection_manager.v3.HttpConnectionManager
          stat_prefix: ingress_http
          codec_type: auto
          use_remote_address: true
          skip_xff_append: false
          access_log:
            name: envoy.file_access_log
            typed_config:
              "@type": "type.googleapis.com/envoy.extensions.access_loggers.file.v3.FileAccessLog"
              path: /dev/stdout
              log_format:
                text_format_source:
                  inline_string: "%DYNAMIC_METADATA(com.reblaze.curiefense:request.info)%\n"
                content_type: "application/json"
          route_config:
            name: local_route
            virtual_hosts:
            - name: target_site_a
              domains: ["*"]
              routes:
              - match:
                  prefix: "/"
                route:
                  cluster: target_site_a
                metadata:
                  filter_metadata:
                    envoy.filters.http.lua:
                      xff_trusted_hops: 1
          http_filters:
          - name: envoy.filters.http.lua
            typed_config:
              "@type": type.googleapis.com/envoy.extensions.filters.http.lua.v3.Lua
              default_source_code:
                inline_string: |
                  local session = require "lua.session_envoy"
                  function envoy_on_request(handle)
                    session.inspect(handle)
                  end
                  function envoy_on_response(handle)
                    session.on_response(handle)
                  end
          - name: envoy.filters.http.router
            typed_config:
              "@type": type.googleapis.com/envoy.extensions.filters.http.router.v3.Router
      transport_socket:
        name: envoy.transport_sockets.tls
        typed_config:
          "@type": type.googleapis.com/envoy.extensions.transport_sockets.tls.v3.DownstreamTlsContext
          common_tls_context:
            tls_certificates:
            - certificate_chain:
                filename: "/run/secrets/curieproxysslcrt"
              private_key:
                filename: "/run/secrets/curieproxysslkey"
# START EXTRA SECTION
            alpn_protocols: ["h2,http/1.1"]
# END EXTRA SECTION
  - name: tlsjuice
    address:
      socket_address:
        address: 0.0.0.0
        port_value: 444
    filter_chains:
    - filters:
      - name: envoy.filters.network.http_connection_manager
        typed_config:
          "@type": type.googleapis.com/envoy.extensions.filters.network.http_connection_manager.v3.HttpConnectionManager
          stat_prefix: ingress_http
          codec_type: auto
          use_remote_address: true
          skip_xff_append: false
          access_log:
            name: "envoy.access_loggers.tcp_grpc"
            typed_config:
              "@type": type.googleapis.com/envoy.extensions.access_loggers.grpc.v3.HttpGrpcAccessLogConfig
              common_config:
                log_name: "test_GRPC_log"
                transport_api_version: "v3"
                grpc_service:
                  envoy_grpc:
                    cluster_name: grpc_log_cluster
          route_config:
            name: local_route
            virtual_hosts:
            - name: target_site_b
              domains: ["*"]
              routes:
              - match:
                  prefix: "/"
                route:
                  cluster: target_site_b
                metadata:
                  filter_metadata:
                    envoy.filters.http.lua:
                      xff_trusted_hops: 1
          http_filters:
          - name: envoy.filters.http.lua
            typed_config:
              "@type": type.googleapis.com/envoy.extensions.filters.http.lua.v3.Lua
              default_source_code:
                inline_string: |
                  local session = require "lua.session_envoy"
                  function envoy_on_request(handle)
                    session.inspect(handle)
                  end
                  function envoy_on_response(handle)
                    session.on_response(handle)
                  end
          - name: envoy.filters.http.router
            typed_config:
              "@type": type.googleapis.com/envoy.extensions.filters.http.router.v3.Router
      transport_socket:
        name: envoy.transport_sockets.tls
        typed_config:
          "@type": type.googleapis.com/envoy.extensions.transport_sockets.tls.v3.DownstreamTlsContext
          common_tls_context:
            tls_certificates:
              - certificate_chain:
                  filename: "/run/secrets/curieproxysslcrt"
                private_key:
                  filename: "/run/secrets/curieproxysslkey"
Once the 2 files listed above have been changed by adding the extra sections visible on the code snippets, you need to re-build the image.
Cd to folder curiefense/curiefense/images and you fill find the following objects:
curiefense/curiefense/images drwxrwxr-x 16 pxcs-admin pxcs-admin 4.0K Dec 24 14:35 .
drwxrwxr-x  6 pxcs-admin pxcs-admin 4.0K Dec 22 15:08 ..
-rwxrwxr-x  1 pxcs-admin pxcs-admin 3.9K Dec 23 15:46 build-docker-images.sh
drwxrwxr-x  4 pxcs-admin pxcs-admin 4.0K Dec 22 15:08 confserver
drwxrwxr-x  2 pxcs-admin pxcs-admin 4.0K Dec 22 15:08 curiefense-nginx-ingress
drwxrwxr-x  2 pxcs-admin pxcs-admin 4.0K Dec 22 15:08 curiefense-rustbuild
drwxrwxr-x  3 pxcs-admin pxcs-admin 4.0K Dec 22 15:08 curieproxy-envoy
drwxrwxr-x  3 pxcs-admin pxcs-admin 4.0K Dec 23 15:07 curieproxy-extproc
drwxrwxr-x  3 pxcs-admin pxcs-admin 4.0K Dec 22 15:08 curieproxy-istio
drwxrwxr-x  3 pxcs-admin pxcs-admin 4.0K Dec 22 15:08 curieproxy-nginx
drwxrwxr-x  3 pxcs-admin pxcs-admin 4.0K Dec 22 15:08 curiesync
drwxrwxr-x  2 pxcs-admin pxcs-admin 4.0K Dec 22 15:08 extproc
drwxrwxr-x  3 pxcs-admin pxcs-admin 4.0K Dec 22 15:08 grafana
drwxrwxr-x  2 pxcs-admin pxcs-admin 4.0K Dec 22 15:08 openresty
drwxrwxr-x  2 pxcs-admin pxcs-admin 4.0K Dec 22 15:08 prometheus
drwxrwxr-x  2 pxcs-admin pxcs-admin 4.0K Dec 22 15:08 redis
drwxrwxr-x  2 pxcs-admin pxcs-admin 4.0K Dec 22 15:08 traffic-metrics-exporter
The script build-docker-images.sh must be executed and it will look after re-building new image that will include changes you applied to envoy yaml configuration files.
As it is, the script rebuilds all images for all components part of curiefense stack. In case you need to re-build only curieproxy-envoy you will have to edit the script and comment all the rest:
#! /bin/bash

# Change directory to this script's location
cd "${0%/*}" || exit 1

# Parameters should be passed as environment variables.
# By default, builds and tags images locally, without pushing
# To push, set `PUSH=1`
# To specify a different repo, set `REPO=my.repo.tld`

REPO=${REPO:-curiefense}
BUILD_OPT=${BUILD_OPT:-}
BUILD_RUST=${BUILD_RUST:-yes}

declare -A status

GLOBALSTATUS=0

if [ -z "$DOCKER_TAG" ]
then
    GITTAG="$(git describe --tag --long --dirty)"
    DOCKER_DIR_HASH="$(git rev-parse --short=12 HEAD:curiefense)"
    DOCKER_TAG="${DOCKER_TAG:-$GITTAG-$DOCKER_DIR_HASH}"
fi

STOP_ON_FAIL=${STOP_ON_FAIL:-yes}

IFS=' ' read -ra RUST_DISTROS <<< "${RUST_DISTROS:-bionic focal}"

if [ -n "$TESTIMG" ]; then
    IMAGES=("$TESTIMG")
    OTHER_IMAGES_DOCKER_TAG="$DOCKER_TAG"
    DOCKER_TAG="test"
    echo "Building only image $TESTIMG"
else
# SECTION BELOW DEFINES WHICH IMAGES WILL BE RE_BUILT
#    IMAGES=(confserver curieproxy-istio curieproxy-envoy \
#        curieproxy-nginx curiesync grafana prometheus extproc \
#        redis traffic-metrics-exporter)
        IMAGES=(curieproxy-envoy)
fi
. . .
Once you adapted the script according to your needs, you can run it (as root).
Once the execution completes, stdout will show the version of image just built (e.g. v1.5.0-824-gc904993f-dirty-88950e011065).
Now, since we decided to re-build only this specific image and not all images for all containers, we need to define a new environment variable (to be included into .env file) and then refer the same into curiefense-envoy service part of docker-compose.yaml.
.env:
ENVOY_UID=0
DOCKER_TAG=main

# BELOW THE IMAGE VERSION TO BE USED FOR ENVOY_PROXY
DOCKER_TAG_ENVOY_PROXY="v1.5.0-824-gc904993f-dirty-88950e011065"

XFF_TRUSTED_HOPS=1
ENVOY_LOG_LEVEL=error
EXTPROC_LOG_LEVEL=info
ELASTICSEARCH="--elasticsearch http://elasticsearch:9200/"
FILEBEAT=yes
CURIE_BUCKET_LINK=file:///bucket/prod/manifest.json
docker-compose.yaml (extract):
version: "3.7"
services:

  curieproxyenvoy:
    container_name: curieproxyenvoy
    hostname: curieproxyenvoy
    #image: "curiefense/curieproxy-envoy:${DOCKER_TAG}"
    image: "curiefense/curieproxy-envoy:${DOCKER_TAG_ENVOY_PROXY}"   # <-- CUSTOM IMAGE VERSION
    restart: always
    volumes:
      - curieproxy_config:/cf-config
      - ./filebeat/ilm.json:/usr/share/filebeat/ilm.json
      - ./filebeat/template.json:/usr/share/filebeat/template.json
    environment:
      - ENVOY_UID
      - TARGET_ADDRESS_A=${TARGET_ADDRESS_A:-pxcs-service.sandbox.diit.health}
      - TARGET_PORT_A=${TARGET_PORT_A:-443}
      - TARGET_ADDRESS_B=${TARGET_ADDRESS_B:-juiceshop}
      - TARGET_PORT_B=${TARGET_PORT_B:-3000}
      - XFF_TRUSTED_HOPS
      - ENVOY_LOG_LEVEL
      - FILEBEAT
      - FILEBEAT_LOG_LEVEL
      - ELASTICSEARCH_URL=${ELASTICSEARCH_URL:-http://elasticsearch:9200}
      - KIBANA_URL=${KIBANA_URL:-http://kibana:5601}
    networks:
      curiemesh:
        aliases:
          - curieproxy
    ports:
      - "80:80"
      - "443:443"
      - "8001:8001"
    secrets:
      - curieproxysslcrt
      - curieproxysslkey
. . .
Caveats
Replacing elasticsearch with Grafana-loki does not seem to be possible at the moment I am writing this post.
The only item I could find which refers to a possible implementation relates to this post: https://github.com/curiefense/curiefense/issues/4
-
Kubernetes observability – log aggregation – Grafana-loki deployment and configuration
Table of Contents
Intro
This page describes how to deploy and apply basic configurations – including retention policies – to a promtail-loki stack.
Loki is a log storage solution tightly integrated with Grafana. It can ingest logs from multiple sources (in our case, containers), index them and makes them accessible via Grafana UI.
Its functionalities overlap with elasticsearch. Grafana-loki is more lightweight since it indexes only entries metadata and not the entire content of each log line.
Data can be pushed into loki with multiple solutions (e.g. promtail, fluent bit, fluentd, logstash, etc.). See https://grafana.com/docs/loki/latest/clients/
This page describes how to use promtail for such purpose.
The following setup is not meant to be used on production environments.
Requirements
- A k8s cluster including Grafana
- all appropriate configurations to use kubectl command line tool
Loki deployment
- Add loki helm chart repo
helm repo add grafana https://grafana.github.io/helm-charts
helm repo update
- Create a file values.yaml to store all chart settings that must be overridden from the default values
loki: commonConfig: replication_factor: 1 storage: type: 'filesystem' compactor: working_directory: /var/loki/data/retention shared_store: filesystem compaction_interval: 10m retention_enabled: true retention_delete_delay: 2h retention_delete_worker_count: 150 schema_config: configs: - from: "2022-12-01" index: period: 24h prefix: loki_index_ object_store: filesystem schema: v11 store: boltdb-shipper storage_config: boltdb_shipper: active_index_directory: /var/loki/data/index cache_location: /var/loki/data/boltdb-cache shared_store: filesystem limits_config: retention_period: 24h write: replicas: 1 read: replicas: 1- Create the namespace
kubectl create namespace loki
- Create 2 PersistentVolumes that will be used by loki read / write components
apiVersion: v1 kind: PersistentVolume metadata: name: loki-pv-1 namespace: loki spec: accessModes: - ReadWriteOnce capacity: storage: 10Gi persistentVolumeReclaimPolicy: Retain local: path: [YOUR_NODE_LOCAL_STORAGE_FOLDER_1] nodeAffinity: required: nodeSelectorTerms: - matchExpressions: - key: kubernetes.io/hostname operator: In values: - [YOUR_NODE_NAME] --- apiVersion: v1 kind: PersistentVolume metadata: name: loki-pv-2 namespace: loki spec: accessModes: - ReadWriteOnce capacity: storage: 10Gi persistentVolumeReclaimPolicy: Retain local: path: [YOUR_NODE_LOCAL_STORAGE_FOLDER_2] nodeAffinity: required: nodeSelectorTerms: - matchExpressions: - key: kubernetes.io/hostname operator: In values: - [YOUR_NODE_NAME]- Install the helm chart
helm install --values values.yaml loki --namespace=loki grafana/loki-simple-scalable
Once all components are started up, you should have the following scenario:
[rockylinux@test-vm grafana-loki]$ kubectl get all -n loki
NAME                                               READY   STATUS    RESTARTS   AGE
pod/loki-gateway-55fccf8654-vcxqt                  1/1     Running   0          23h
pod/loki-grafana-agent-operator-684b478b77-vwh9g   1/1     Running   0          23h
pod/loki-logs-wwcp5                                2/2     Running   0          23h
pod/loki-read-0                                    1/1     Running   0          32m
pod/loki-write-0                                   1/1     Running   0          32m

NAME                          TYPE        CLUSTER-IP       EXTERNAL-IP   PORT(S)             AGE
service/loki-gateway          ClusterIP   10.106.191.67    <none>        80/TCP              23h
service/loki-memberlist       ClusterIP   None             <none>        7946/TCP            23h
service/loki-read             ClusterIP   10.103.120.150   <none>        3100/TCP,9095/TCP   23h
service/loki-read-headless    ClusterIP   None             <none>        3100/TCP,9095/TCP   23h
service/loki-write            ClusterIP   10.98.226.44     <none>        3100/TCP,9095/TCP   23h
service/loki-write-headless   ClusterIP   None             <none>        3100/TCP,9095/TCP   23h

NAME                       DESIRED   CURRENT   READY   UP-TO-DATE   AVAILABLE   NODE SELECTOR   AGE
daemonset.apps/loki-logs   1         1         1       1            1           <none>          23h

NAME                                          READY   UP-TO-DATE   AVAILABLE   AGE
deployment.apps/loki-gateway                  1/1     1            1           23h
deployment.apps/loki-grafana-agent-operator   1/1     1            1           23h

NAME                                                     DESIRED   CURRENT   READY   AGE
replicaset.apps/loki-gateway-55fccf8654                  1         1         1       23h
replicaset.apps/loki-grafana-agent-operator-684b478b77   1         1         1       23h

NAME                          READY   AGE
statefulset.apps/loki-read    1/1     23h
statefulset.apps/loki-write   1/1     23h
Promtail deployment
Promtail tails log files and pushed them into loki.
To deploy all required components, apply the following yaml:
--- # Daemonset.yaml
apiVersion: apps/v1
kind: DaemonSet
metadata:
  name: promtail-daemonset
spec:
  selector:
    matchLabels:
      name: promtail
  template:
    metadata:
      labels:
        name: promtail
    spec:
      serviceAccount: promtail-serviceaccount
      containers:
      - name: promtail-container
        image: grafana/promtail
        args:
        - -config.file=/etc/promtail/promtail.yaml
        env:
        - name: 'HOSTNAME' # needed when using kubernetes_sd_configs
          valueFrom:
            fieldRef:
              fieldPath: 'spec.nodeName'
        volumeMounts:
        - name: logs
          mountPath: /var/log
        - name: promtail-config
          mountPath: /etc/promtail
        - mountPath: /var/lib/docker/containers
          name: varlibdockercontainers
          readOnly: true
      volumes:
      - name: logs
        hostPath:
          path: /var/log
      - name: varlibdockercontainers
        hostPath:
          path: /var/lib/docker/containers
      - name: promtail-config
        configMap:
          name: promtail-config
--- # Daemonset.yaml
apiVersion: apps/v1
kind: DaemonSet
metadata:
  name: promtail-daemonset
spec:
  selector:
    matchLabels:
      name: promtail
  template:
    metadata:
      labels:
        name: promtail
    spec:
      serviceAccount: promtail-serviceaccount
      containers:
      - name: promtail-container
        image: grafana/promtail
        args:
        - -config.file=/etc/promtail/promtail.yaml
        env:
        - name: 'HOSTNAME' # needed when using kubernetes_sd_configs
          valueFrom:
            fieldRef:
              fieldPath: 'spec.nodeName'
        volumeMounts:
        - name: logs
          mountPath: /var/log
        - name: promtail-config
          mountPath: /etc/promtail
        - mountPath: /var/lib/docker/containers
          name: varlibdockercontainers
          readOnly: true
      volumes:
      - name: logs
        hostPath:
          path: /var/log
      - name: varlibdockercontainers
        hostPath:
          path: /var/lib/docker/containers
      - name: promtail-config
        configMap:
          name: promtail-config -- # configmap.yaml
apiVersion: v1
kind: ConfigMap
metadata:
  name: promtail-config
data:
  promtail.yaml: |
    server:
      http_listen_port: 9080
      grpc_listen_port: 0

    clients:
      - url: http://loki-write.loki.svc.cluster.local:3100/loki/api/v1/push
        tenant_id: 1

    positions:
      filename: /tmp/positions.yaml
    target_config:
      sync_period: 10s
    scrape_configs:
    - job_name: pod-logs
      kubernetes_sd_configs:
        - role: pod
      pipeline_stages:
        - docker: {}
      relabel_configs:
        - source_labels:
            - __meta_kubernetes_pod_node_name
          target_label: __host__
        - action: labelmap
          regex: __meta_kubernetes_pod_label_(.+)
        - action: replace
          replacement: $1
          separator: /
          source_labels:
            - __meta_kubernetes_namespace
            - __meta_kubernetes_pod_name
          target_label: job
--- # Daemonset.yaml
apiVersion: apps/v1
kind: DaemonSet
metadata:
  name: promtail-daemonset
spec:
  selector:
    matchLabels:
      name: promtail
  template:
    metadata:
      labels:
        name: promtail
    spec:
      serviceAccount: promtail-serviceaccount
      containers:
      - name: promtail-container
        image: grafana/promtail
        args:
        - -config.file=/etc/promtail/promtail.yaml
        env:
        - name: 'HOSTNAME' # needed when using kubernetes_sd_configs
          valueFrom:
            fieldRef:
              fieldPath: 'spec.nodeName'
        volumeMounts:
        - name: logs
          mountPath: /var/log
        - name: promtail-config
          mountPath: /etc/promtail
        - mountPath: /var/lib/docker/containers
          name: varlibdockercontainers
          readOnly: true
      volumes:
      - name: logs
        hostPath:
          path: /var/log
      - name: varlibdockercontainers
        hostPath:
          path: /var/lib/docker/containers
      - name: promtail-config
        configMap:
          name: promtail-config -- # configmap.yaml
apiVersion: v1
kind: ConfigMap
metadata:
  name: promtail-config
data:
  promtail.yaml: |
    server:
      http_listen_port: 9080
      grpc_listen_port: 0

    clients:
      - url: http://loki-write.loki.svc.cluster.local:3100/loki/api/v1/push
        tenant_id: 1

    positions:
      filename: /tmp/positions.yaml
    target_config:
      sync_period: 10s
    scrape_configs:
    - job_name: pod-logs
      kubernetes_sd_configs:
        - role: pod
      pipeline_stages:
        - docker: {}
      relabel_configs:
        - source_labels:
            - __meta_kubernetes_pod_node_name
          target_label: __host__
        - action: labelmap
          regex: __meta_kubernetes_pod_label_(.+)
        - action: replace
          replacement: $1
          separator: /
          source_labels:
            - __meta_kubernetes_namespace
            - __meta_kubernetes_pod_name
          target_label: job         - action: replace
          source_labels:
            - __meta_kubernetes_namespace
          target_label: namespace
        - action: replace
          source_labels:
            - __meta_kubernetes_pod_name
          target_label: pod
        - action: replace
          source_labels:
            - __meta_kubernetes_pod_container_name
          target_label: container
        - replacement: /var/log/pods/*$1/*.log
          separator: /
          source_labels:
            - __meta_kubernetes_pod_uid
            - __meta_kubernetes_pod_container_name
          target_label: __path__
--- # Clusterrole.yaml
apiVersion: rbac.authorization.k8s.io/v1
kind: ClusterRole
metadata:
  name: promtail-clusterrole
rules:
  - apiGroups: [""]
    resources:
    - nodes
    - services
    - pods
    verbs:
    - get
    - watch
    - list

--- # ServiceAccount.yaml
apiVersion: v1
kind: ServiceAccount
metadata:
  name: promtail-serviceaccount

--- # Rolebinding.yaml
apiVersion: rbac.authorization.k8s.io/v1
kind: ClusterRoleBinding
metadata:
  name: promtail-clusterrolebinding
subjects:
    - kind: ServiceAccount
      name: promtail-serviceaccount
      namespace: default
roleRef:
    kind: ClusterRole
    name: promtail-clusterrole
    apiGroup: rbac.authorization.k8s.io
Loki datasource configuration on Grafana admin UI
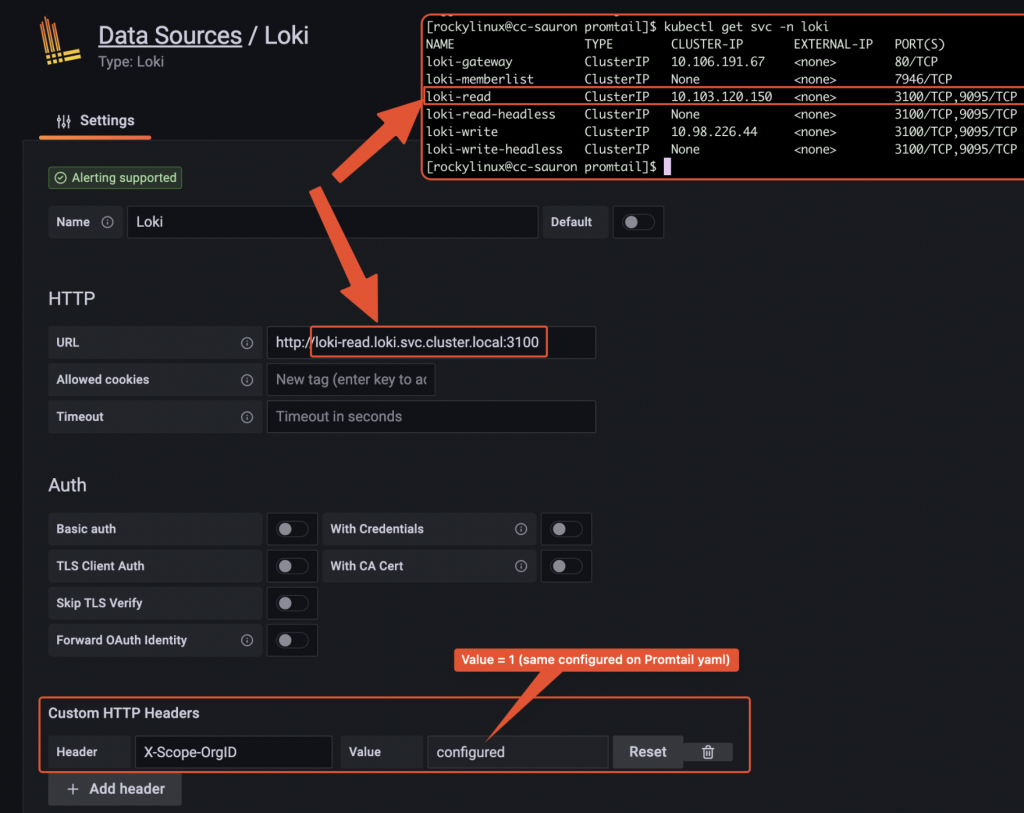
Datasource configuration on Grafana Browsing logs from Grafana UI
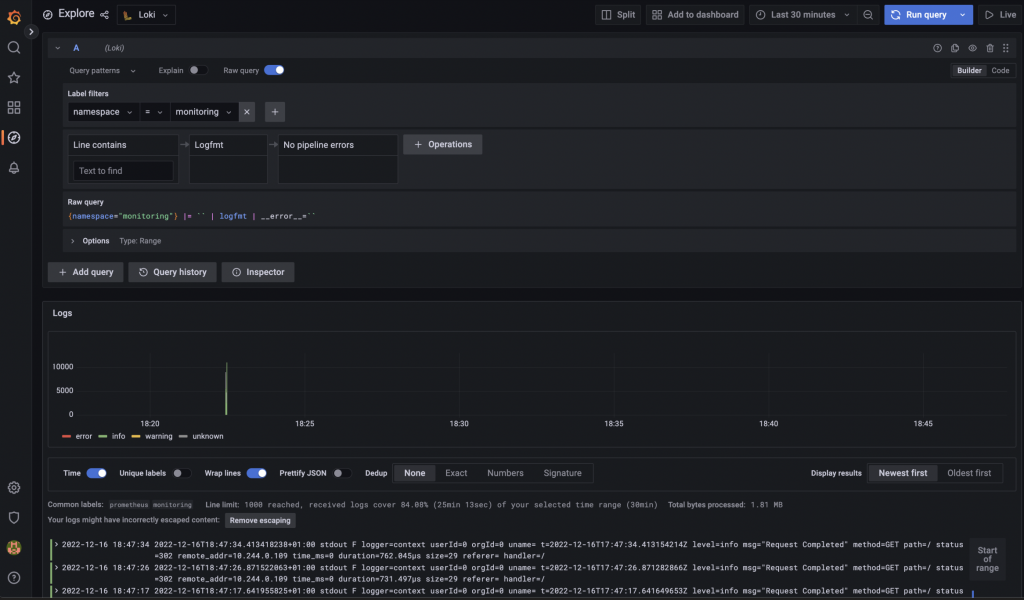
Data browser on Grafana